Semi-sync replication is not slow!

If you read Yoshinori’s post about Semi-sync at Facebook, he lists the objective of using semi-sync as an alternative to running full durability on a master. That is to say that once you can guarantee writes have safely been shipped across the network, you may not strictly need to guarantee that they are safe locally.

This is something that I have been wanting to benchmark for a long time, and reading Jay’s post about Semi-sync replication performance in MySQL 5.7 DMR4 and a conversation in last week’s #dbhangops inspired me to explore this in more detail. For my tests, I will be using Master-Slave replication and three alternative definitions of durability:

  • Local Durability. By ensuring that sync_binlog=1 and innodb_flush_log_at_trx_commit=1 any changes that are committed locally will be crash-safe (provided that underlying hardware does not lie). A slave will be connected, but using asynchronous replication.
  • Network Durability. By enabling semi-sync replication, each change will be guaranteed on more than one machine. However, each machine will take a relaxed view to how safe the changes are locally (sync_binlog=0, innodb_flush_log_at_trx_commit=0). This is the MySQL Cluster definition of durability, and also some NoSQL systems. It requires that each replica has physical isolation (in the case of AWS: an availability zone).
  • Local + Network Durability. This is a strict definition where both semi-sync and network durability is employed. While it might seem excessively strict, what I like about this option, is that it has the potential to reduce administrative costs during failure events.

Testing

Basic setup details:

  • AWS EC2 m3.medium instances
  • Master in us-east-1b, slave in us-east-1d
  • Latest Amazon Linux AMI
  • MySQL 5.7 DMR4
  • Datadir stored on 40GB Provisioned IOPS EBS volume (900 IOPS)
  • sysbench 0.5 update_index.lua test

I measured both the network latency (ping) and disk latency (dd bs=512 count=1000 if=/dev/zero of=testfile oflag=dsync) prior to starting the test. Interestingly, both were the same at about 2ms.

My first test was to compare single threaded performance:

singlethreaded

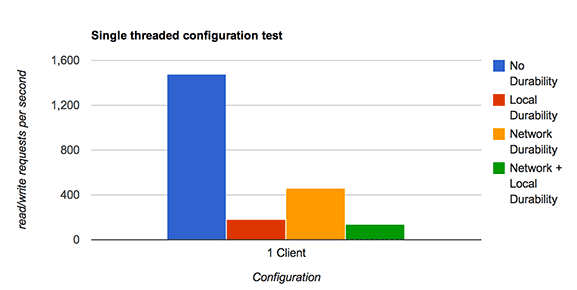
I would say that the results are somewhat as expected:

  • Performance when not durable is awesome! (but probably not useful)
  • Local durability is quite expensive in single-threaded workloads. There is not much opportunity for group-commit, and the 2ms latency I have for an fsync hurts to be able to safely write the InnoDB redo logs + the binary logs.
  • Network durability actually performs better than local durability.
  • The combination of Local+Network durability is worse than network only or local only.

Now to repeat the same test, but in 32-threads:

32threads

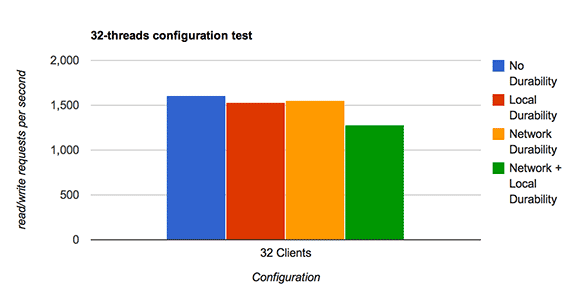
What is interesting to note is that:

  • No durability still performs the best, but by a much smaller margin.
  • The improved group-commit in MySQL 5.6+ is really helping the local durability throughput increase.
  • Network durability is marginally ahead of local durability.
  • Network+Local is about 15% worse than just local durability.

Comparing Local versus Network Durability

So network durability scored better than local in both tests!?

I think at this point it’s important to explain the difference between local and network durability in the event of a crash, using our current set of tools that are available. If we are using asynchronous replication with a durable local master, and crash safe slaves, then resuming replication is actually possible in the event of a crash. This is not true in the case of network durability, as writes could be lost on the failing machine. This is an important loss of functionality that is difficult to justify.

I would also point out that I think it is easier to hardware-accelerate local durability than it is network durability. The local fsync speed can be improved with an SSD or a RAID Controller with a battery-backed write cache. Network latency can be lowered too, but it might be harder to do so while keeping physical isolation.

Conclusion

For the reasons I listed, I still think local durability is still more useful when choosing just one option for durability. But at the same time, semi-sync is no slouch and it’s great to see new developments in this area in MySQL 5.7.

What I did not test, is configuring MySQL to be mostly-durable locally, and fully network durable. There is a lot of potential to meet somewhere in the middle and very selectively disable features such as the InnoDB doublewrite buffer.

I do not think it is fair to label semi-sync as “slow”, and I am hoping to convince more users that they should take a look 🙂

How important is it to use 2-byte and 3-byte integers?

One interesting feature of MySQL, is that it supports a very large number of integer data types. From the MySQL manual:

Type Storage Minimum Value Maximum Value
(Bytes) (Signed/Unsigned) (Signed/Unsigned)
TINYINT 1 -128 127
0 255
SMALLINT 2 -32768 32767
0 65535
MEDIUMINT 3 -8388608 8388607
0 16777215
INT 4 -2147483648 2147483647
0 4294967295
BIGINT 8 -9223372036854775808 9223372036854775807
0 18446744073709551615

I have previously written on How important it is to using the correct datatype in MySQL, but I find that between integer types I don’t always follow my own advice. I predominantly use TINYINT, INT, and BIGINT, and usually as the default of SIGNED rather than UNSIGNED.

Am I lazy? I think it is best to run through examples…

Primary Key Integer

In this example lets say that we know that we will never have more than 65535 customers, so we have the choice of using a SMALLINT UNSIGNED at 2 bytes, or lazily an INT will accommodate 2147483647 customers at 4 bytes:

Option #1:
CREATE TABLE customers (
id SMALLINT UNSIGNED PRIMARY KEY auto_increment,
company_name VARCHAR(20),
..
..
last_order_date DATETIME
);
Option #2:
CREATE TABLE customers (
id INT PRIMARY KEY auto_increment,
company_name VARCHAR(20),
..
..
last_order_date DATETIME
);

I will project that there are 50000 rows in the table, which is about as close as you would want to get to the maximum range possible of SMALLINT. Using SMALLINT provides a 2 byte saving per row:

2 * 50000 = 100000 = A saving of 97KB

In InnoDB the primary key is included in every other index on the table, so technically we will save an additional ~97KB per-index, but I would say that this saving is too small to matter for most cases.

Attribute on a large table

Option #1:
CREATE TABLE page_views (
id BIGINT PRIMARY KEY auto_increment,
site_id SMALLINT UNSIGNED NOT NULL,
..
..
);
Option #2:
CREATE TABLE page_views (
id BIGINT PRIMARY KEY auto_increment,
site_id INT NOT NULL,
..
..
);

In this example, I will say that there are 1 billion rows in the page_views table:

1 billion * 2 bytes saving per row = 1.8GB

So the choice of using a SMALLINT over an INT has more measurable savings in this case. On a per unindexed column basis I could be saving around 2GB. So with five SMALLINT columns on the same row, I could save 10GB.

Is 10GB worth it? It is maybe easier to answer this question when expressed as a percentage saving for a table. To use some optimistic overhead numbers (that assume very little fragmentation) for InnoDB:

  • ~13 bytes per row (MVCC features)
  • ~1KB per 16K page (page fill factor)

I’ll look at two table definitions. One with the best case of all SMALLINT columns in place of INT, and one with a VARCHAR column that is assumed to be 50 bytes on average:

Option #1:
CREATE TABLE page_views (
id BIGINT PRIMARY KEY auto_increment,
site_id SMALLINT UNSIGNED NOT NULL, /* or INT */
page_id SMALLINT UNSIGNED NOT NULL, /* or INT */
category_id SMALLINT UNSIGNED NOT NULL, /* or INT */
region_id SMALLINT UNSIGNED NOT NULL, /* or INT */
time_id SMALLINT UNSIGNED NOT NULL /* or INT */
);
Option #2:
CREATE TABLE page_views (
id BIGINT PRIMARY KEY auto_increment,
site_id SMALLINT UNSIGNED NOT NULL, /* or INT */
page_uri VARCHAR(2048) NOT NULL, /* assume average length of 50 bytes */
category_id SMALLINT UNSIGNED NOT NULL, /* or INT */
region_id SMALLINT UNSIGNED NOT NULL, /* or INT */
time_id SMALLINT UNSIGNED NOT NULL /* or INT */
);
# INT/SMALLINT only:
(13B (overhead) + 8B (pkey) + 5*2) * 1.06 * 1 billion = 30.60 GB
(13B (overhead) + 8B (pkey) + 5*4) * 1.06 * 1 billion = 40.47 GB
# One VARCHAR column:
(13B (overhead) + 8B (pkey) + 4*2 + 50 (varchar)) * 1.06 * 1 billion = 77.9GB
(13B (overhead) + 8B (pkey) + 4*4 + 50 (varchar)) * 1.06 * 1 billion = 85.9GB

So in the INT/SMALLINT table there is about a 25% saving by using smaller data types, and about a 10% saving in the case of the single VARCHAR column.

I do think that 25% is worth caring about, so maybe in this case I could follow my own advice a little closer 🙂 However, I would also consider this a close to best-case situation that I have used to illustrate a point. I would expect typical space savings to be less than 10%.

One other point to consider, is that changing the datatype of a column is not supported by Online DDL. It is important not to sub-optimize data type choices and have to make changes later.

Did I miss anything? Please leave a comment.

Five reasons why vertical scalability matters

The latest benchmarks show that MySQL 5.7 is now able to scale to 60 cores, which is quite an incredible feat when you compare to the 4-8 core scaling of MySQL 5.1 just a few years ago. These improvements are the result of a lot of heavy lifting to reorganize internal locking structures, and I have an earlier blog post on what is a mutex anyway? which may help serve as an introduction.

While I consider horizontal scaling and projects like MySQL Fabric to be very important, it should be stated that horizontal and vertical scaling are really orthogonal choices. That is to say that a given database technology should ideally support both options, and today I wanted to zoom in on some of the advantages I see with being able to scale vertically:

  1. Having more cores offers more consistent performance. Think of a single CPU as like shopping at a convenience store with one person on the checkout. The experience is very good when there is nobody else in line, but it degrades very quickly when just a couple of shoppers are lined up before you.

    To add to that, even if you know that there are an average of 60 customers per hour, you can not expect them to arrive at an equal distribution of one customer per minute. What usually happens is a more random pattern (see Poisson distribution) of arrivals.

    The solution to this problem is to have more staff available at the checkout. The more staff available, the less variance in the time that it takes to serve a customer. Similarly, having multiple CPUs means that query times will degrade much nicer as there are subtle spikes in load.

  2. Simplified debugging and performance characteristics. For some applications, where the lifetime growth requirements can be answered by a single server (or single master, multiple HA slaves), having a single primary server can be beneficial.

    The number of transactions/second that a single-server can now respond to is also much higher than it used to be. Dimitri’s 5.7 Sysbench OLTP_RW shows 15K transactions/second (or over 500K point select queries/second), and prematurely introducing architectural-complexity through horizontal scaling may increase the effort required to troubleshoot problems. In some cases it may also artificially prevent desirable features such as strong consistency (ACID).

  3. Good insurance for the unknown. Some applications grow in unexpected ways, and being able to scale up offers a great upgrade path that is less likely to change performance characteristics than horizontal scaling, and require fewer application changes.

    Often the cost of higher-end commodity hardware is less than that of custom-development time. I once experienced the case where a legacy application that was planned for decommission started having performance problems. Paying for the biggest EC2 instance type was worth it for a few months, and we probably would have paid more if other options were available (they were not at the time, but are now).

  4. Increased efficiency at scale. That is to say that even with automation, it is easier to manage 1000 16-core instances than it is to manage 16000 single core instances.

  5. An alternative consolidation strategy to virtualization. For some organizations, backing up and maintaining many small database servers presents operational complexity, even when the underlying servers lie on virtualized hardware. Having a larger single database instance with many database schemas can offer an alternative that may be easier to manage.

    I concede that there is some functionality missing on the MySQL-side to truly realize this potential, since it would be nice to be able to set more fine-grained quotas per application and limit the ability to accidentally Denial of Service other applications. However, some headway has been made with performance_schema now able to instrument things that were previously not possible. Most notably, in MySQL 5.7, memory can now instrumented per user.

Conclusion

I wanted to close with an example of how the horizontal and vertical should work together. Lets say that you operate a SaaS application with millions of users, and have the option to either massively-shard or use a single larger server. Both options may be sub-optimal:

Vertical Scaling Horizontal Scaling

PRO: Having vertical scalability allows each user to have some burstable performance that can be absorbed by larger hardware.

CON: It is possible that an extremely busy users will impact all other users, creating an all-eggs-in-one-basket scenario.

PRO: Multiple horizontal shards allows some natural fencing where the extreme spikes can be contained to group of users. This assumes that indivual users do not need cross-shard queries, otherwise it hinges on my point above under “Simplified debugging and performance characteristics”.

CON: If the application is excessively horizontally scaled, some of the busier users may have a bad experience as their shard becomes overloaded too quickly. Quite often these busy users can be the ones with the most revenue associated to them.

By horizontally scaling across many vertically scalable servers, you can get closer to get the best of both worlds.

Optimizing InnoDB Transactions

(This is a cross-post from the Engine Yard blog. The original article appears here.)
Here is a question I’ve actually been asked a few times:

“I am writing a batch processing script which modifies data as part of an ongoing process that is scheduled by cron. I have the ability to group a number of modifications together into a transaction, but I’m not sure what the correct number is?”

First off, I think that this question is interesting not just in the context of batch processing, but it equally applies to all parts of the application. If you are designing a high throughput system for MySQL, there are actually some potential pain points that you can design your way around.

Potential Pain Points

Here are the situations where the size of the transaction could impact performance:
Very Small Transactions
Using MySQL’s auto_commit mode (or modifying just one row at a time) can cause some internal pressure on InnoDB’s redo log system, since it has to make sure that its in-memory buffer is safely flushed to disk. This flushing is required to be able to provide durability, and safely recover all changes that have been committed if the server crashes.

Note that this durability requirement can be disabled by setting innodb_flush_log_at_trx_commit=2 (default: 1), or the impact can be reduced by installing a RAID controller with a battery backed write cache or a fast SSD.
Very Long Transactions
To understand what I mean by “long”, lets use this hypothetical example:

START TRANSACTION;
/* Modify Data */
sleep(60)
COMMIT;

The problem with these transactions, is that even if they do not modify much data, because of a feature called Multiversion Concurrency Control InnoDB internally needs to keep around older versions of rows that were modified in other transactions. There is an internal clean-up thread which is constantly trying to purge older versions, but in the case of a very long transaction it will sit and wait until after a COMMIT/ROLLBACK event occurs.
In the example above, I used sleep(60) to illustrate a point, but in a very high throughut system it may not even need to be this long to start impacting performce.
Very large Transactions
By very large transactions, I simply mean transactions which modify very large amounts of data. There are a couple of risks that you need to be aware of in this case:

  • Locks will be held for the duration of a transaction. By modifying more rows at once, you may increase the number of deadlocks or introduce lock wait contention.
  • Rolling back transactions can be 30 times the cost of a corresponding apply transaction. It is important to note that rolling back may be something you requested, but it will also happen in the case of a disconnect or a deadlock.

Closing Advice

I think it’s easy to get lost in the details and sub-optimize to eliminate any potential problems. Fear not! I have a two step process to avoiding the vast majority of all issues:

  • Move intensive application processing logic to before or after transaction running. While you have a transaction open, try and make any changes that you need to make and COMMIT as soon as possible. i.e.
/* do intensive processing */
START TRANSACTION;
/* Modify Data */
COMMIT;
/* more intensive processing */
  • You usually can’t go wrong by using transactions as they were originally intended: commit logical units of work together. As mentioned above you can actually run into problems using auto_commit with row-at-a-time processing, as well as batches that are too large. My advice would be to keep transactions to modifying less than 10K rows at a time.

Good luck!

Today's practical use-case for Performance Schema

Today’s blog post starts with a question:

“In my continuous integration environment, running tests currently takes 30 minutes. I
believe that a large percentage of time is spent in MySQL, and I want to know if putting MySQL
on tmpfs will cut that time down?”.

I have previously written about how to configure MySQL to be less durable in testing environments, but today I wanted to write about how we can really test the assumption that the question is based around. That is to say:

  • We know that total time is 30 minutes.
  • We assume MySQL is a large percentage of this.
  • We know that this optimization will potentially allow us to avoid IO.
  • We then want to know what amount of time MySQL spends waiting on IO during our test suite?

And the answer to this is performance schema.
Performance Schema instruments File IO with statistics such as bytes read/written, and wait time. So if we see that IO wait time was only a small percentage of the 30 minutes of test time, we automatically know if this optimization is worth investigating or not.
Here is a simple query that will work on 5.6 out of the box:

mysql> SELECT
 `a`.`EVENT_NAME`,
 `a`.`SUM_TIMER_WAIT`/1024/1024/1024 AS `total_latency_ms`,
 `b`.`SUM_NUMBER_OF_BYTES_READ` AS `total_bytes_read`,
 `b`.`SUM_NUMBER_OF_BYTES_WRITE` AS `total_bytes_written`
FROM
 `performance_schema`.`events_waits_summary_global_by_event_name` `a`
 INNER JOIN `performance_schema`.`file_summary_by_event_name` `b` USING (event_name)
WHERE
 `a`.`EVENT_NAME` like 'wait/io/file/%'
 AND `a`.`COUNT_STAR` > 0\G
*************************** 1. row ***************************
         EVENT_NAME: wait/io/file/sql/casetest
   total_latency_ms: 0.245716745034
   total_bytes_read: 0
total_bytes_written: 0
*************************** 2. row ***************************
         EVENT_NAME: wait/io/file/sql/ERRMSG
   total_latency_ms: 0.911862457171
   total_bytes_read: 58982
total_bytes_written: 0
*************************** 3. row ***************************
         EVENT_NAME: wait/io/file/sql/FRM
   total_latency_ms: 50.292402482592
   total_bytes_read: 137771
total_bytes_written: 0
*************************** 4. row ***************************
         EVENT_NAME: wait/io/file/sql/global_ddl_log
   total_latency_ms: 0.012274521403
   total_bytes_read: 0
total_bytes_written: 0
*************************** 5. row ***************************
         EVENT_NAME: wait/io/file/sql/pid
   total_latency_ms: 0.218277866021
   total_bytes_read: 0
total_bytes_written: 5
*************************** 6. row ***************************
         EVENT_NAME: wait/io/file/mysys/charset
   total_latency_ms: 0.450179565698
   total_bytes_read: 18316
total_bytes_written: 0
*************************** 7. row ***************************
         EVENT_NAME: wait/io/file/mysys/cnf
   total_latency_ms: 0.315982563421
   total_bytes_read: 56
total_bytes_written: 0
*************************** 8. row ***************************
         EVENT_NAME: wait/io/file/myisam/dfile
   total_latency_ms: 0.885083482601
   total_bytes_read: 2322
total_bytes_written: 0
*************************** 9. row ***************************
         EVENT_NAME: wait/io/file/myisam/kfile
   total_latency_ms: 3.881758853793
   total_bytes_read: 7058
total_bytes_written: 0
*************************** 10. row ***************************
         EVENT_NAME: wait/io/file/innodb/innodb_data_file
   total_latency_ms: 114.101030502468
   total_bytes_read: 10223616
total_bytes_written: 49152
*************************** 11. row ***************************
         EVENT_NAME: wait/io/file/innodb/innodb_log_file
   total_latency_ms: 2.865770795383
   total_bytes_read: 69632
total_bytes_written: 3072
11 rows in set (0.01 sec)

Taking it one step further and combining with ps_helper, I think there is a real opportunity to build this metrics collection into the test suite:

/* start by reseting all metrics */
ps_helper.truncate_all();
/* run test suite */
/* Collect test suite metrics from MySQL */
SELECT * FROM ps_helper.wait_classes_global_by_latency;

Here is an example for wait_classes_global_by_latency from the GitHub project:

mysql> select * from wait_classes_global_by_latency;
+-------------------+--------------+---------------+-------------+-------------+-------------+
| event_class       | total_events | total_latency | min_latency | avg_latency | max_latency |
+-------------------+--------------+---------------+-------------+-------------+-------------+
| wait/io/file      |       550470 | 46.01 s       | 19.44 ns    | 83.58 µs    | 4.21 s      |
| wait/io/socket    |       228833 | 2.71 s        | 0 ps        | 11.86 µs    | 29.93 ms    |
| wait/io/table     |        64063 | 1.89 s        | 99.79 ns    | 29.43 µs    | 68.07 ms    |
| wait/lock/table   |        76029 | 47.19 ms      | 65.45 ns    | 620.74 ns   | 969.88 µs   |
| wait/synch/mutex  |       635925 | 34.93 ms      | 19.44 ns    | 54.93 ns    | 107.70 µs   |
| wait/synch/rwlock |        61287 | 7.62 ms       | 21.38 ns    | 124.37 ns   | 34.65 µs    |
+-------------------+--------------+---------------+-------------+-------------+-------------+

Neat, huh?

What is a mutex anyway?

While I was working on the MySQL Workbench booth at MySQL Connect this year, an attendee came up and asked what a mutex was and how important it is to them in their function as a DBA.
It’s a good question. The short answer is:
Mutexes are mutually exclusive locks and are designed to prevent concurrent access to resources that in doing so may result in unsafe conditions.
They are required as part of virtually all multi-threaded applications (not just MySQL), and are not something that you can specifically prevent from happening. This is a different concept to row-locks and table locks.

Some examples

If the InnoDB buffer pool is full, internally free space needs to be created in order to be able to load your desired page into memory. What you don’t want, is in between freeing and loading somebody else to take your desired free-slot.
When a page becomes too full, it may need to split data into other pages. It is possible that there could be a thread deadlock if two pages left and right of each-other reach this condition at once and can’t decide who should proceed first.

Should you care as a DBA?

Yes, and no.
No in the sense that you are not expected to fix these problems, they are usually very internal to the operations of the database and require a MySQL developer to fix them.
Yes in the sense that newer MySQL versions often change the way internal locking works if a mutex becomes hot for a large number of users. Hot is the terminology used to describe a mutex which has other threads blocked waiting for it for a large amount of time. This contention reduces scalability on multi-core machines because some threads sit idle, essentially waiting for the ablity to run.

Hot Mutex History

Here is an incomplete list of some of the mutexes worked on in newer versions of MySQL:
MySQL 5.7:

  • Index lock contention is reduced via introduction of a new SX lock mode. This improves performance of large tables.

  • The LOCK_thread_count mutex protected several independent internal server structures and variables, and was a bottleneck, particularly affecting server performance in the circumstance when many clients were connecting and disconnecting at once.

MySQL 5.6:

  • The kernel mutex is split into smaller, localized locks. This mutex previous covered many different internal tasks to InnoDB.
  • LOCK_open mutex is split – this mutex used to be a mutex to protect the metadata of a table within the MySQL Server.
  • The default configuration was changed, so that InnoDB has 8 buffer pool instances when the buffer pool is > 1GB.

MySQL 5.5:

How can you see if a mutex is hot?

Various metadata commands can expose mutexes that are hot. For example: SHOW ENGINE INNODB STATUS, SHOW ENGINE INNODB MUTEX and PERFORMANCE_SCHEMA. Operating specific tools can also be used, such as oprofile or Linux Perf.
Here is an example from SHOW ENGINE INNODB MUTEX (via dimitrik):

mysql> show engine innodb mutex;
+--------+----------------------------+-------------------+
| Type   | Name                       | Status            |
+--------+----------------------------+-------------------+
| InnoDB | log/log0log.c:775          | os_waits=26       |
| InnoDB | log/log0log.c:771          | os_waits=1        |
| InnoDB | buf/buf0buf.c:1208         | os_waits=3219     |
| InnoDB | buf/buf0buf.c:1208         | os_waits=6990     |
| InnoDB | buf/buf0buf.c:1208         | os_waits=4619     |
| InnoDB | buf/buf0buf.c:1208         | os_waits=5627     |
| InnoDB | buf/buf0buf.c:1208         | os_waits=7873     |
| InnoDB | buf/buf0buf.c:1208         | os_waits=4466     |
| InnoDB | buf/buf0buf.c:1208         | os_waits=16929    |
| InnoDB | buf/buf0buf.c:1208         | os_waits=19305    |
| InnoDB | buf/buf0buf.c:1208         | os_waits=16301962 |
| InnoDB | buf/buf0buf.c:1208         | os_waits=11649    |
| InnoDB | buf/buf0buf.c:1208         | os_waits=950471   |
| InnoDB | buf/buf0buf.c:1208         | os_waits=6545     |
| InnoDB | buf/buf0buf.c:1208         | os_waits=4262     |
| InnoDB | buf/buf0buf.c:1208         | os_waits=5642     |
| InnoDB | buf/buf0buf.c:1208         | os_waits=7878     |
| InnoDB | buf/buf0buf.c:1208         | os_waits=387166   |
| InnoDB | fil/fil0fil.c:1559         | os_waits=1265     |
| InnoDB | srv/srv0srv.c:987          | os_waits=460452   |
| InnoDB | combined buf/buf0buf.c:900 | os_waits=38503    |
| InnoDB | log/log0log.c:832          | os_waits=184      |
| InnoDB | combined buf/buf0buf.c:901 | os_waits=77       |
+--------+----------------------------+-------------------+
23 rows in set (0.56 sec)

Here is an example of SHOW ENGINE INNODB STATUS (via the MySQL forums):

..
----------
SEMAPHORES
----------
OS WAIT ARRAY INFO: reservation count 334026866, signal count 322155474
--Thread 139787989395216 has waited at ../../../storage/innobase/trx/trx0undo.c line 1684 for 165.00 seconds the semaphore:
Mutex at 0x7f23518408c0 created file ../../../storage/innobase/trx/trx0rseg.c line 147, lock var 1
waiters flag 1
--Thread 139788009264912 has waited at ../../../storage/innobase/btr/btr0cur.c line 463 for 165.00 seconds the semaphore:
S-lock on RW-latch at 0x7f230fbd2b48 created in file ../../../storage/innobase/buf/buf0buf.c line 550
a writer (thread id 139787989395216) has reserved it in mode exclusive
number of readers 0, waiters flag 1
Last time read locked in file ../../../storage/innobase/btr/btr0cur.c line 463
Last time write locked in file ../../../storage/innobase/btr/btr0cur.c line 463
--Thread 139787997423376 has waited at ../../../storage/innobase/trx/trx0roll.c line 921 for 15.00 seconds the semaphore:
Mutex at 0x7f23518408c0 created file ../../../storage/innobase/trx/trx0rseg.c line 147, lock var 1
waiters flag 1
--Thread 139788384470800 has waited at ../../../storage/innobase/btr/btr0cur.c line 463 for 15.00 seconds the semaphore:
X-lock on RW-latch at 0x7f230f558038 created in file ../../../storage/innobase/buf/buf0buf.c line 550
a writer (thread id 139788006655760) has reserved it in mode exclusive
number of readers 0, waiters flag 1
Last time read locked in file ../../../storage/innobase/btr/btr0cur.c line 463
Last time write locked in file ../../../storage/innobase/btr/btr0cur.c line 463
..

And one for PERFORMANCE_SCHEMA (via Mark Leith):

SELECT EVENT_NAME,
 SUM_TIMER_WAIT/1000000000 WAIT_MS,
 COUNT_STAR
FROM performance_schema.EVENTS_WAITS_SUMMARY_GLOBAL_BY_EVENT_NAME
ORDER BY SUM_TIMER_WAIT DESC, COUNT_STAR DESC LIMIT 30;
+---------------------------------------------------------+-------------+------------+
| EVENT_NAME                                              | WAIT_MS     | COUNT_STAR |
+---------------------------------------------------------+-------------+------------+
| wait/io/file/innodb/innodb_data_file                    | 150562.0345 |     182750 |
| wait/io/file/innodb/innodb_log_file                     |  77795.5425 |       8913 |
| wait/synch/rwlock/innodb/checkpoint_lock                |  11636.7894 |       1284 |
| wait/synch/rwlock/innodb/btr_search_latch               |   7429.2204 |   39677465 |
| wait/io/file/myisam/kfile                               |   7353.2737 |       2011 |
| wait/synch/mutex/innodb/kernel_mutex                    |   4115.0534 |   59198510 |
| wait/synch/mutex/innodb/fil_system_mutex                |   3473.8341 |    1263809 |
| wait/io/file/myisam/dfile                               |   2940.5701 |        641 |
| wait/synch/mutex/innodb/buf_pool_mutex                  |   2650.8666 |   33982979 |
| wait/synch/mutex/innodb/rw_lock_mutex                   |   1261.8025 |   18877546 |
| wait/io/file/sql/FRM                                    |    116.6419 |        863 |
| wait/synch/cond/sql/COND_thread_count                   |      1.4073 |          1 |
| wait/io/file/sql/pid                                    |      1.2654 |          3 |
| wait/synch/mutex/innodb/mutex_list_mutex                |      0.7675 |      16727 |
| wait/synch/mutex/innodb/rw_lock_list_mutex              |      0.4023 |       8331 |
| wait/io/file/sql/dbopt                                  |      0.2745 |         12 |
| wait/io/file/sql/casetest                               |      0.2041 |          5 |
| wait/synch/mutex/innodb/thr_local_mutex                 |      0.2009 |       2050 |
| wait/synch/mutex/mysys/THR_LOCK_open                    |      0.1993 |        989 |
| wait/synch/rwlock/innodb/trx_purge_latch                |      0.1436 |        255 |
| wait/io/file/sql/ERRMSG                                 |      0.1432 |          5 |
| wait/synch/rwlock/sql/LOCK_grant                        |      0.1375 |        188 |
| wait/synch/rwlock/sql/MDL_lock::rwlock                  |      0.1013 |        481 |
| wait/synch/mutex/sql/Query_cache::structure_guard_mutex |      0.0923 |        628 |
| wait/synch/mutex/mysys/THR_LOCK_myisam                  |      0.0781 |        283 |
| wait/synch/rwlock/sql/Query_cache_query::lock           |      0.0676 |        198 |
| wait/io/file/mysys/charset                              |      0.0561 |          3 |
| wait/synch/mutex/sql/LOCK_open                          |      0.0529 |        543 |
| wait/synch/mutex/mysys/THR_LOCK_lock                    |      0.0504 |        244 |
| wait/synch/mutex/innodb/srv_innodb_monitor_mutex        |      0.0424 |         75 |
+---------------------------------------------------------+-------------+------------+
30 rows in set (0.00 sec)

Query optimization versus caching

Today I wanted to look at the relative merits of different optimization paths that can be taken on a Greenfield project. That is to say, one that has no constraints imposed on it by previous decisions made, and has received little to no optimization work to date.
Specifically, the two optimizations I wanted to compare are optimizing mysql versus caching. I should point out in advance that these optimizations are really orthogonal. The only thing that ties you to doing one versus the other is that they both consume the resource developer time.

Optimizing MySQL

This optimization typically starts by taking a look at the queries that are being sent to MySQL and running EXPLAIN over them. With some investigation it’s frequently common to add an index or make a small tweak to schema.
Advantages:

  1. An optimized query is usually fast for all users accessing the application. Since indexes cut-through data via logarithmic search (aka divide and conquer like you would search a phone book), they also sustain performance somewhat with data growth. A cache masking an unindexed query can sometimes perform even worse as the data grows. With growth, users who don’t hit the cache may have such poor performance the application is not useable.
  2. Optimizing MySQL does not require you to worry about invalidating cache or serving stale data from a cache.
  3. Optimizing MySQL can keep the technology stack simpler, which makes it slightly easier to replicate and work with in development environments.

Disadvantages:
1. Some queries can not be improved via just indexes and may require schema changes which can be difficult to retrofit into some applications.
2. Some schema changes may be for de-normalization (duplication of data). While this is a common technique for DBAs, it needs ownership to make sure that all places are updated by the application, or triggers are installed to guarantee such changes.
3. Some optimizations may be MySQL-specific. That is to say if the underlying software is shipped to work on multiple databases, it is difficult to justify some of the more complex optimizations that go beyond adding indexes.

Adding a cache

This optimization requires one to profile the application, and move expensive processing away from MySQL and into a third-party cache such as memcached or Redis.
Advantages:
1. This works really well when the application has expensive queries that are difficult to optimize with MySQL. For example: large aggregate/GROUP BY queries.
2. Caching can be a good retrofit to increase throughput of the system. i.e. when slowness is a result of many people accessing the application at once.
3. Caching may sit on top of another application easier. For example: your application may just be a front-end to another software package that stores data in MySQL. It might be very difficult to make any database changes to that other application.
Disadvantages:
1. If the data has many access patterns to being served (i.e. appears on many different pages in different formats), then invalidating the cache on update may be difficult and/or require stale data to be served. An alternative to this, is to store data in a more fine-grained cache. This has its own disadvantages, such as added latency from many cache fetches.
2. Caching an object that is expensive to generate may create lurking performance cliffs for users that miss the cache (see Optimizing MySQL advantage #1). Good performance practice suggests that you should try and tighten the variance between users, not just the average (as caching tends to do).
3. Naive caching implementations suffer from subtle bugs, such as cache stampedes. Just last week I helped someone who’s database server was brought down by multiple users trying to regenerate the same cache contents at once. The correct solution would be to introduce some level of locking to serialize the cache regeneration.

Conclusion

I typically recommend users take a look at optimizing MySQL first, as I see this as initially the most elegant solution. But long term most applications do have a use-case for implementing some level of both approaches.

Commentary on MySQL slow query collection sources

The other day it struck me that MySQL applications have no fewer than four sources to be able to collect potentially slow queries for analysis, and that I actually find myself using 3/4 methods available.
Here are the methods listed, and my commentary on where I will use each of them:

Application Logging/Monitoring

I enjoy using Application-level tools such as New Relic or xhprof to find slow experiences rather than just slow queries.
What I mean by this, is that there is not a 1:1 between pages and queries, so sometimes just heading straight to the database can be the wrong decision. As I wrote on Monday, latency is a factor with N+1 queries, and I typically want to focus on queries in aggregate that exceed page generation goals. On the same note, I also pay less attention to queries that are part of background tasks and do not impact user experience.
I also like monitoring application tools like a hawk whenever I am running any operational changes (i.e. removing indexes that I am 99.99% confident are unused, disabling the query cache). New Relic has about a 3 minute delay over real-time, but this is usually good enough for me, since it increases my confidence on top of whatever DB dashboards I am already looking at.

Performance Schema

In MySQL 5.6, the performance_schema can now instrument statements. In combination with ps_helper I find this to be easiest way to identify what has been running on a particular database server.
What I love about this, is that it’s enabled by default and can stay enabled full time with a zero second slow query threshold.
Maybe it’s just anecdotal, but I also find with performance_schema that I can react very fast, and won’t miss anything. There used to be this situation where I would need to stalk the PROCESSLIST or make sure I lower the long_query_time in time to see a particular problem.
(I should also note, that the MySQL Enterprise Monitor 3.0 uses the PERFORMANCE_SCHEMA to show statement performance. The Enterprise Tools team is one of the driving forces behind PERFORMANCE_SCHEMA – it’s great to see that the interfaces they use are available to all.)

Slow query log file

I use this for more of a long play analysis, by setting the long_query_time=0, then letting it run for between 20 minutes and a few hours. When I have enough data in the log file, I will restore the long_query_time to a high value and then copy my slow log file across the network to another server for processing.
The best tool to process this file is pt-query-digest – I routinely give it a 20GB+ file, and I love the output format it provides, since it has a histogram with useful statistics.
Even with the introduction of performance_schema, there will probably always be a use for the slow query log in some form, but in 5.6 I find I am using this method less for ‘routine’ investigations. Here is why:

  • I counted it out – what I do is an eight step process.
    1. Rotate the slow query log file (to avoid historical data skew)
    2. lower the long_query_time
    3. bounce applications that use connection pooling
    4. record for 20 minutes (watching dashboards for impact)
    5. increase the long_query_time
    6. rotate the log file again
    7. copy file to a different host
    8. run pt-query-digest
  • I am worried that in one of those eight steps, I will screw up and leave the long_query_time at zero seconds. I’ll find out when I have a midnight page saying I’m critically low on disk space.

What I think would make me use this method more, is if I were able to specify a maximum size per slow log file (i.e. 2GB) and then a maximum number of log files to retain (i.e. 10) and have MySQL manage rotation and deletion of old files for me.

Slow query log table

I don’t use this method. Since the queries in the slow log table do not include the digest, it’s not possible to aggregate them in any meaningful way. What you usually have to do, is write a script to extract the slow query log table into the slow query log file format(!), then run pt-query-digest.
This feature may be helpful for cloud providers who do not want to provide local filesystem access to customers. However, at least in the case of Amazon RDS there is a way that you can access the slow query log files.


Update: A commenter on Google+ let me know that I forgot to mention network traffic inspection as an collection source. An oversight on my part. The best use case I have for this method is to workaround step (3) I mentioned in slow query log analysis – you don’t need to bounce connections to start collecting queries.

How important is it to merge queries together?

Reading Ernie’s post today inspired me to write about something I’ve been wanting to write about for a while: how much of a performance impact you should expect from network latency.

Hypothetical Numbers

I’m going to throw out some web-application ‘back of the envelope’ numbers which I will then use for examples:

  • The goal is to generate a page within 200-500ms.
  • Network latency between the application server and DB server is 0.5-1ms.

There will be use-cases which have goals far more agressive than this, for example advertising server goals are closer to 50ms. I have also seen network latency well below 1ms. I encourage commenters to correct me where they disagree 😉

Analysis

So if we say that a typical web page requires 5-10 queries to render, you can see that the amount of time spent in network latency could actually be very low:

10 queries @ 1ms each = 10ms, or 5% of our 200ms goal.
10 queries @ 0.5ms each = 5ms, or 2.5% of our 200ms goal.

However, what I want to do is illustrate the effects of the N+1 query pattern. That is, some applications will naively repeat a query inside a looping structure. So using the numbers we have established, lets take a look at the difference between:

  • SELECT * FROM Country – 239 rows in 1 query.
  • SELECT * FROM Country WHERE code = '?' – 239 queries with one row each.

Using performance_schema + ps_helper, I can show the time that it takes to execute on the server:

mysql> select * from statement_analysis\G
*************************** 4. row ***************************
        query: SELECT * FROM `country`
    full_scan: *
   exec_count: 3
    err_count: 0
   warn_count: 0
total_latency: 3.41 ms
  max_latency: 1.17 ms
  avg_latency: 1.14 ms
    rows_sent: 717
rows_sent_avg: 239
 rows_scanned: 717
       digest: 53567ecd08977b34a4532202a10871f4
*************************** 6. row ***************************
        query: SELECT * FROM `country` WHERE CODE = ?
    full_scan:
   exec_count: 5
    err_count: 0
   warn_count: 0
total_latency: 1.19 ms
  max_latency: 249.08 us
  avg_latency: 238.78 us
    rows_sent: 5
rows_sent_avg: 1
 rows_scanned: 5
       digest: cc32c7d6ec9e2803dea1ff95f458520a

Because the SELECT * FROM Country retrieves every row, it is going to be a table scan (which is quite efficient in this case). We can see that the query time is 1.14ms to retrieve all 239 rows versus 0.239ms to retrieve just a single row.
Retrieving all 239 rows from MySQL as primary key lookups takes 0.239ms * 239 = 57ms.
However, once you account for 0.5ms network latency:
* The single step retrieval is 1.14 + 0.5 = 1.64ms.
* Row-at-a-time retrieval is 119.5ms + 57ms = 176.5ms.
And with 1ms network latency:
* The single step retrieval is 1.14 + 1 = 2.14ms.
* Row-at-a-time retrieval is 239ms + 57ms = 296ms.
This example is largely the “worst-case” situation, which I am using to illustrate an example. 2.14ms versus 296ms isn’t even comparable 🙂 To apply context – this difference will basically double my page generation goal of 200-500ms.

Merging Queries

My next example to run through, is what happens when we merge queries together. In this case retrieving multiple rows via primary key at once:

SELECT * FROM Country WHERE code IN ('AUS', 'USA', 'CAN');

instead of:

SELECT * FROM Country WHERE code = 'AUS';
SELECT * FROM Country WHERE code = 'USA';
SELECT * FROM Country WHERE code = 'CAN';

We have the time for the single row query above. Here is the timing information from ps_helper for the IN list query:

*************************** 8. row ***************************
        query: SELECT * FROM `Country` WHERE CODE IN (...)
    full_scan:
   exec_count: 4
    err_count: 0
   warn_count: 0
total_latency: 1.19 ms
  max_latency: 318.66 us
  avg_latency: 296.59 us
    rows_sent: 12
rows_sent_avg: 3
 rows_scanned: 12
       digest: b19ca11697506fac486dd35535c37c32

With 0.5ms network latency total time is:
* (0.29659ms + 1 roundtrip) = 0.8 ms total
* (0.23878ms x 3 + 3 roundtrips) = 2.2ms total
With 1ms network latency:
* (0.29659ms + 1 roundtrip) = 1.3 ms total
* (0.23878ms x 3 + 3 roundtrips) = 3.7ms total
So by merging 3 queries together, I very nearly received a 3x reduction in query time.
Another was to look at this, is that for simple queries the execution cost can be near-free on the MySQL side. Network latency really can matter.

How important is using the correct datatype in MySQL?

Frequently in performance talks I hear speakers talk about the importance of using the correct datatypes for storing values in columns. i.e. representing a number with an INT or BIGINT, storing IP addresses as INT UNSIGNED, and VARCHAR(60) instead of VARCHAR(255).
This advice is correct, but today I thought I would try my best to go into a bit more detail 🙂

The Reasons

I can think of three reasons why this optimization is true:

  1. Using numeric data types as strings incurs some added CPU overhead performing character-set and collation work. i.e. it’s not free to make 'Montréal' = 'Montreal' = 'MONTREAL', but MySQL behaves this way by default.

  2. Using correct data types will save space. By ‘space’ usually memory-fit is more important than disk fit, as it can improve cache efficiency. Disk fit can also be important with smaller SSDs.

  3. Some wire protocol and client library buffers are not variable in length. This is a little out of scope of my knowledge area, but you should expect more memory consumption with larger VARCHAR values – so going to just a little bit of effort judging expected length can help.

Memory Fit

I would rate reason (2) above as the most likely reason for why this optimization is correct. In fact, I would say that a large majority of optimizations made by DBAs are to try and stretch out memory fit for as long as possible. i.e. indexes prevent table scans,
and allow you to focus on just the data you need.
Lets take a look at memory fit improvements by concentrating on data types:

  • Short primary keys. There is a lot of space to be saved by keeping your PRIMARY KEY as short as possible. InnoDB uses a clustered index, with the value of the PRIMARY KEY also included in each secondary index as an internal row pointer.

  • Smaller values for indexed columns. Indexed values are essentially duplicated because they appear in both the index and the table row, so there is an amplification created by any inefficiency.

    How much of a memory fit improvement you will gain depends on how the index is accessed. For example:

    • SELECT DISTINCT(indexed_col) FROM my_table requires all of the index in memory to be efficient.
    • Ranged access such as SELECT * FROM my_table WHERE indexed_col BETWEEN x AND y may also require more memory fit if the ranges are wide. However, this can also be true for non ranged access (i.e. SELECT * FROM my_table WHERE indexed_col = x) if indexed_col is not unique and matches a number of rows.
    • If the index has good cardinality (i.e. a high distribution of values), and the queries executed focus on a smaller percentage of values, then memory fit may be less important.
  • Smaller values for un-indexed columns. It is also important to make sure that any un-indexed columns are small, but to a lesser degree. The case where I expect it to matter the most is if your workload includes table scans, or if there is the situation where ‘hot’ rows are highly scattered amongst a large number of pages.

    Small side-note: MySQL 5.6 allows you to change the InnoDB page size, which may help improve memory fit in this case too.

That’s all I can think of. What am I missing?